Subject is pulling away from baseline
Index vs control · period 0 = 0 · 6 periods
 Source: Illustrative product analytics (fictional)
Data Visualisation lab by Gagan Malik — judgment over catalogue: which comparison to draw (level, rate, share, index), how to show fog (confidence bands, forecast fans), when to use small multiples, waffles and per-capita maps instead of raw choropleths, and what not to trust (radar rankings, overstuffed donuts, area-as-people). Forced-dark SVG on site --chart-* tokens.
गगन मलिक द्वारा
Versus baseline, peer, prior, or target.
Index vs control · period 0 = 0 · 6 periods
Source: Illustrative product analytics (fictional)Score 0–100 · before vs after · demo pair
Source: Illustrative experiment (fictional)Score 0–100 · you vs cohort median · Q2 2025
Source: Illustrative product health benchmark (fictional)Score by category — you vs. cohort average
Source: Demo dataActual vs gap to target · onboarding funnel · week 32, 2025
Source: Illustrative OKR dashboard (fictional)Two values compared, sorted by size of gap
Source: Demo data% within age band · Leave vs Remain · Jul 2025 poll
Source: Fictional omnibus survey, n=1,800Last 7 days
Source: Demo dataMark the series or period that breaks the pack.
Metric by cohort, over time
Source: Demo dataBrand health vs price sensitivity · index · 2018–2024
Source: Illustrative brand tracker (fictional)Arrow points from before → after, on two measures at once
Source: Demo dataA vs B, with the flagged outlier called out
Source: Demo dataRank over time — 1 is top
Source: Demo dataRunning total, step by step
Source: Demo dataIndex over time
Source: Demo dataAbove Average
Source: Demo dataBands, fans, and distributions — not just the point.
Modelled estimate · 95% CI · t = −2…11
Source: Illustrative statistical model (fictional)MAU (thousands) · UK + IE fintech · Aug 2025 forecast
Source: Illustrative MAU projection (fictional)Aug 2024 – Aug 2025
Source: Demo dataMin–max per period, by group
Source: Demo dataDistribution by group
Source: Demo dataEach dot is one observation
Source: Demo dataDays-to-first-value density · H1 2025 cohort · by segment
Source: Illustrative onboarding timing (fictional)One line per item, one axis per dimension
Source: Demo dataShared-scale panels beat spaghetti.
Sales index · Jan 2025 = 100 · six UK regions · Jun 2025
Source: Illustrative regional sales index (fictional)Inline sparklines
Source: Demo dataIndex over time
Source: Demo dataSupport tickets per day · EU timezone · Jul–Aug 2025
Source: Illustrative helpdesk export (fictional)Intensity by row and month
Source: Demo dataWaffles and rates — not raw choropleths.
People per 100 · UK bank app adopters · Mar 2025
Source: Illustrative adoption survey (fictional), n=2,400Event share vs per 100 people · five UK regions · 2024
Source: Illustrative public-health events (fictional)Cumulative income share · household deciles · FY2024
Source: Illustrative inequality snapshot (fictional)Share of total exposure · schematic regions · demo
Source: Teaching toy (not Natural Earth)Forms that usually fail the job.
Pick a better form when you see these
Source: Data Visualisation lab — judgment notesHow you're performing in each category, 0–100
Source: Demo dataShare of total, %
*Percentages may not sum to 100 due to rounding.
Source: Demo dataWhen the mix is the story.
% responding, by period
Source: Demo pollingCount at each stage
Source: Demo dataMost used
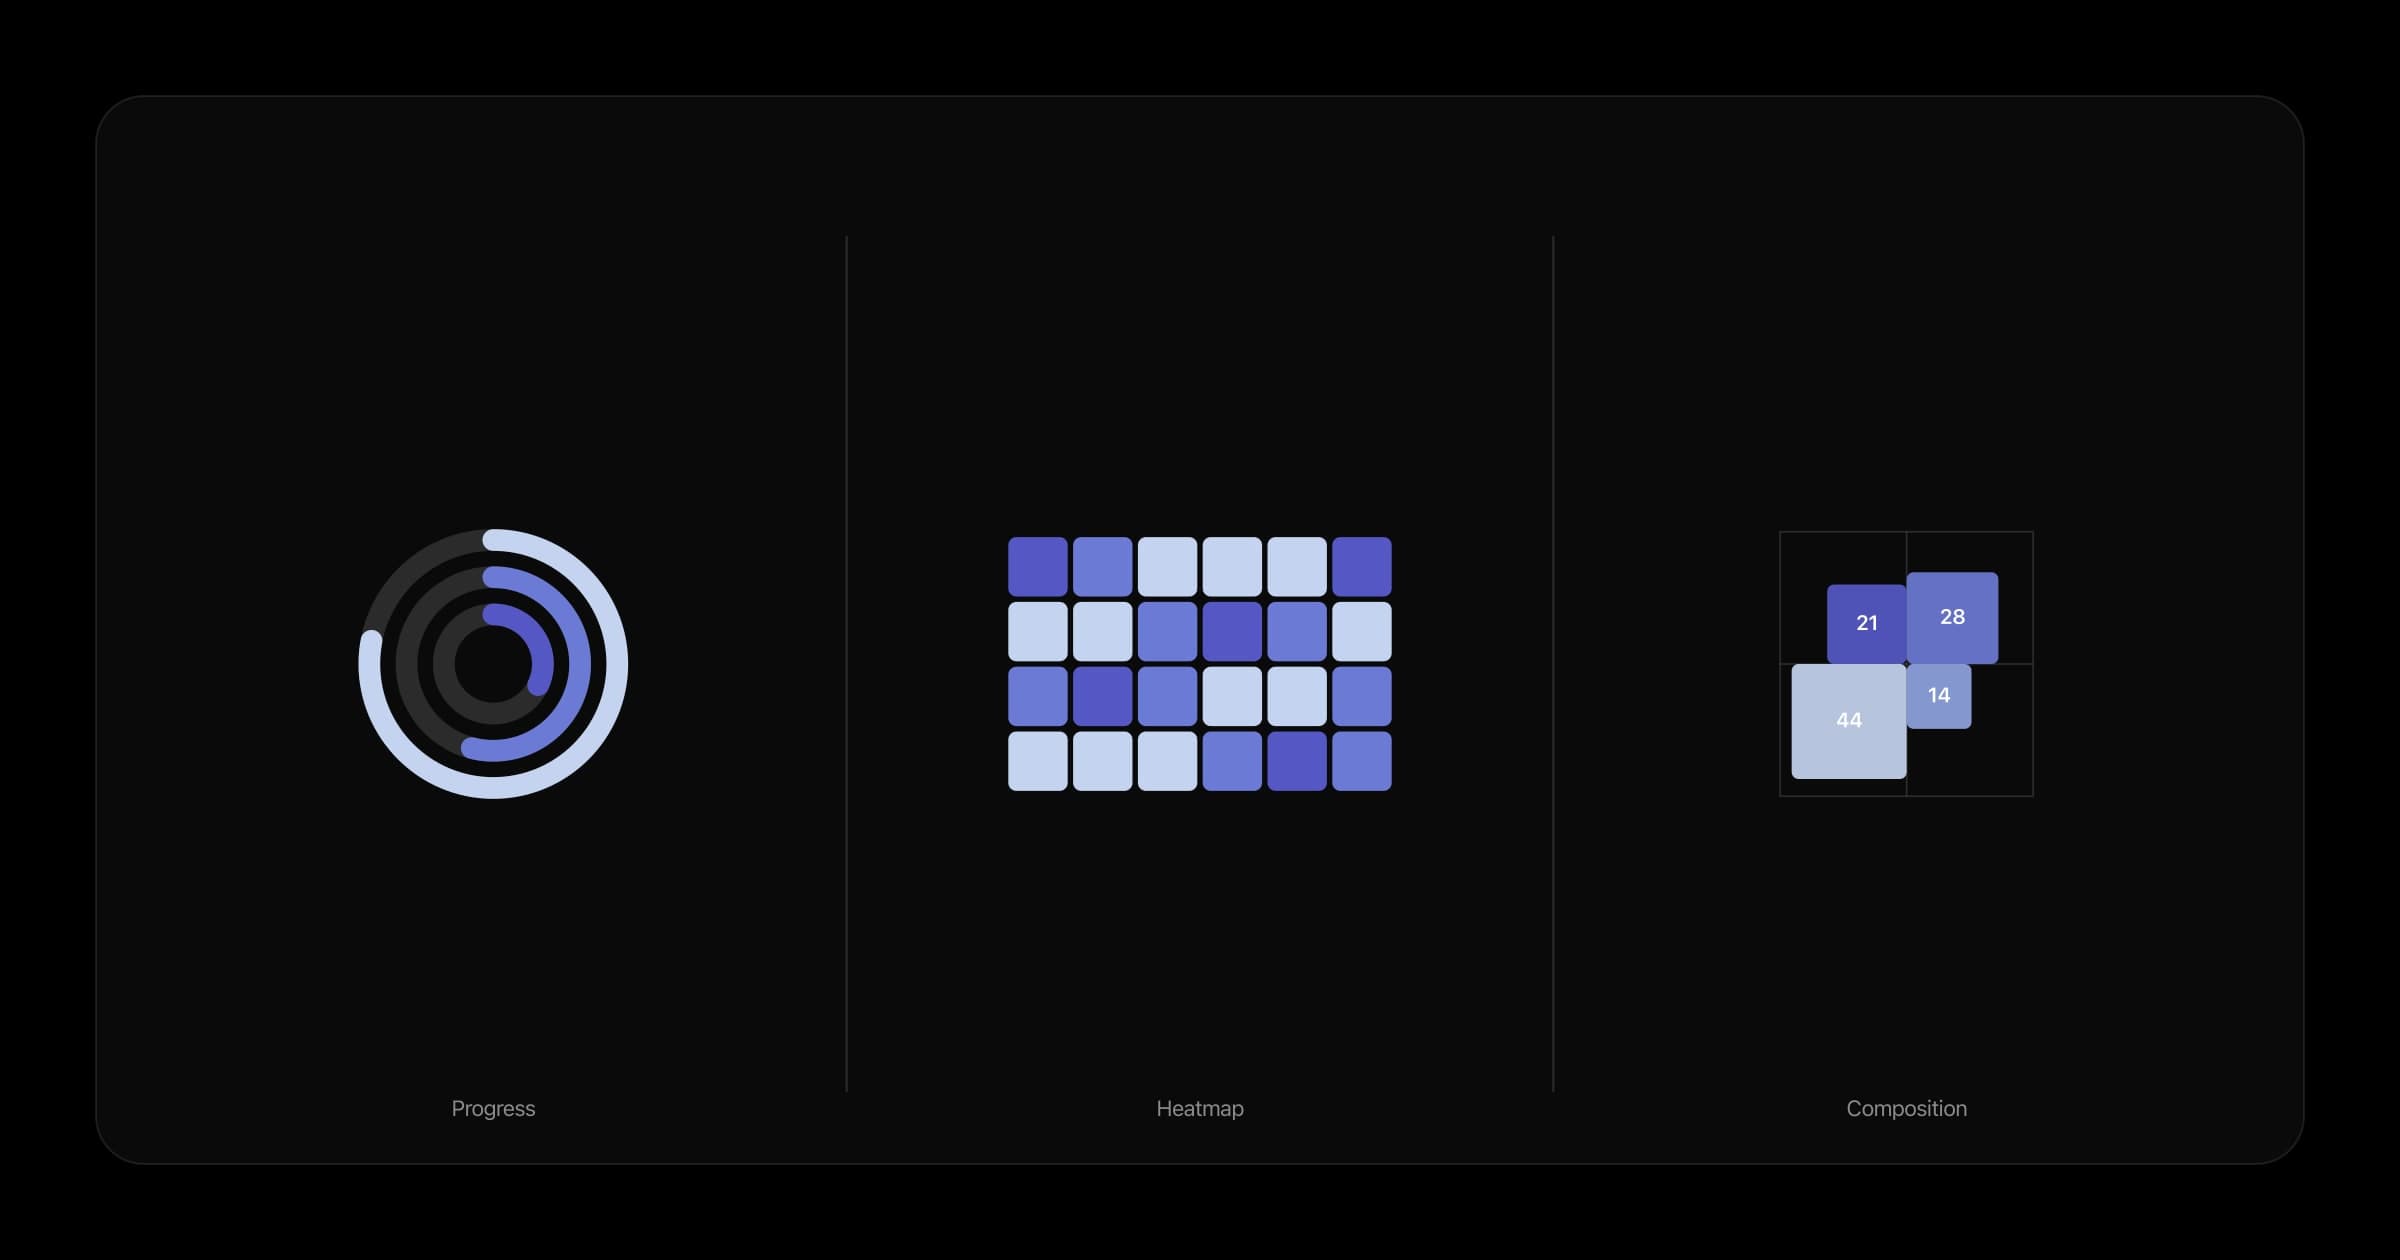
Source: Demo dataRectangle size = share of total
Source: Demo dataInner ring = category, outer ring = sub-item
Source: Demo dataValue-sized quadrants — box area is proportional to value
Source: Demo dataStage-to-stage volume
Source: Demo dataShare reporting each frequency, %
Source: Demo dataStacked with a wiggle baseline, not a flat one
Source: Demo dataGains above the line, losses below
Source: Demo dataWhen place is causal.
Composite index by country, 0–100
Source: Demo dataIndex 0–100, trailing 5 periods
Source: Demo dataAll states and union territories
Source: Demo dataValue by location — the highlighted point is the one that matters
Source: Demo dataPath over time, by stop
Source: Demo dataBy state, % of population
Source: Demo dataStrategy diagrams.
Decision tree with chance nodes — outcomes weighted by probability
*EV = (payoff × probability) + (payoff × probability). Choose the branch with the higher expected value.
Source: Demo dataSequential game tree — the entrant moves first, the incumbent responds
*Payoffs shown as (Entrant, Incumbent). Backward induction: the incumbent accommodates rather than fights (2 > –2), so entry is rational and the incumbent’s threat is not credible.
Source: Demo dataPayoff matrix — (Player A, Player B), classic Prisoner's Dilemma
Source: Demo dataStag Hunt: high payoff if both cooperate, but risk of mutual loss
Source: Demo dataBest-response curves — Firm B's optimal quantity given Firm A's choice
The Nash equilibrium occurs where both firms' best-response curves intersect. Each firm is maximizing profit given the other's choice.
Source: Demo dataBidder payoff by bid level (sealed-bid first-price auction)
The optimal bid balances the probability of winning (higher bid = higher P(win)) against payoff if winning (bid = lower profit margin).
Source: Demo dataPrisoner's Dilemma — share of rounds both players cooperated
Both players start cooperating, but incentives to defect build. Once defection begins, cooperation rarely returns.
Source: Demo dataNode size = importance, line = relationship
Source: Demo dataPlans देखें, सवाल पूछें, या कॉल बुक करें।
NewsroomPage.rss.body


