One region leads the ranking. The lead is a level, not a change.
Five regions, ranked. Each bar starts at zero.
 Source: Illustrative. Drawn to show the form.
Data Visualisation lab by Gagan Malik — judgment over catalogue: which comparison to draw (level, rate, share, index), how to show fog (confidence bands, forecast fans), when to use small multiples, waffles and per-capita maps instead of raw choropleths, and what not to trust (radar rankings, overstuffed donuts, area-as-people). Forced-dark SVG on site --chart-* tokens.
بقلم جاجان مالك
سمِّ المهمة أولاً، ثم الشكل. كل بطاقة هي الشكل. الرسم الجاهز يأخذ أرقام النص نفسه.
10 أشكال
Bar
Five regions, ranked. Each bar starts at zero.
Source: Illustrative. Drawn to show the form.يُستخدم. Amounts across a handful of categories, against a named baseline, peer, prior period or target
لا يُستخدم. Bars with no comparison named, or a scale cut short without saying so
Dumbbell
Four regions. The left dot is the earlier value, the right dot the later one.
Source: Illustrative. Drawn to show the form.يُستخدم. Two values for each category, such as before and after, or actual against target
لا يُستخدم. More than two points on one row
Slopegraph
Four items, before and after. The rank of the change is the slope.
Source: Illustrative. Drawn to show the form.يُستخدم. The change between exactly two moments, for several items
لا يُستخدم. Three or more moments. Use a line or a bump
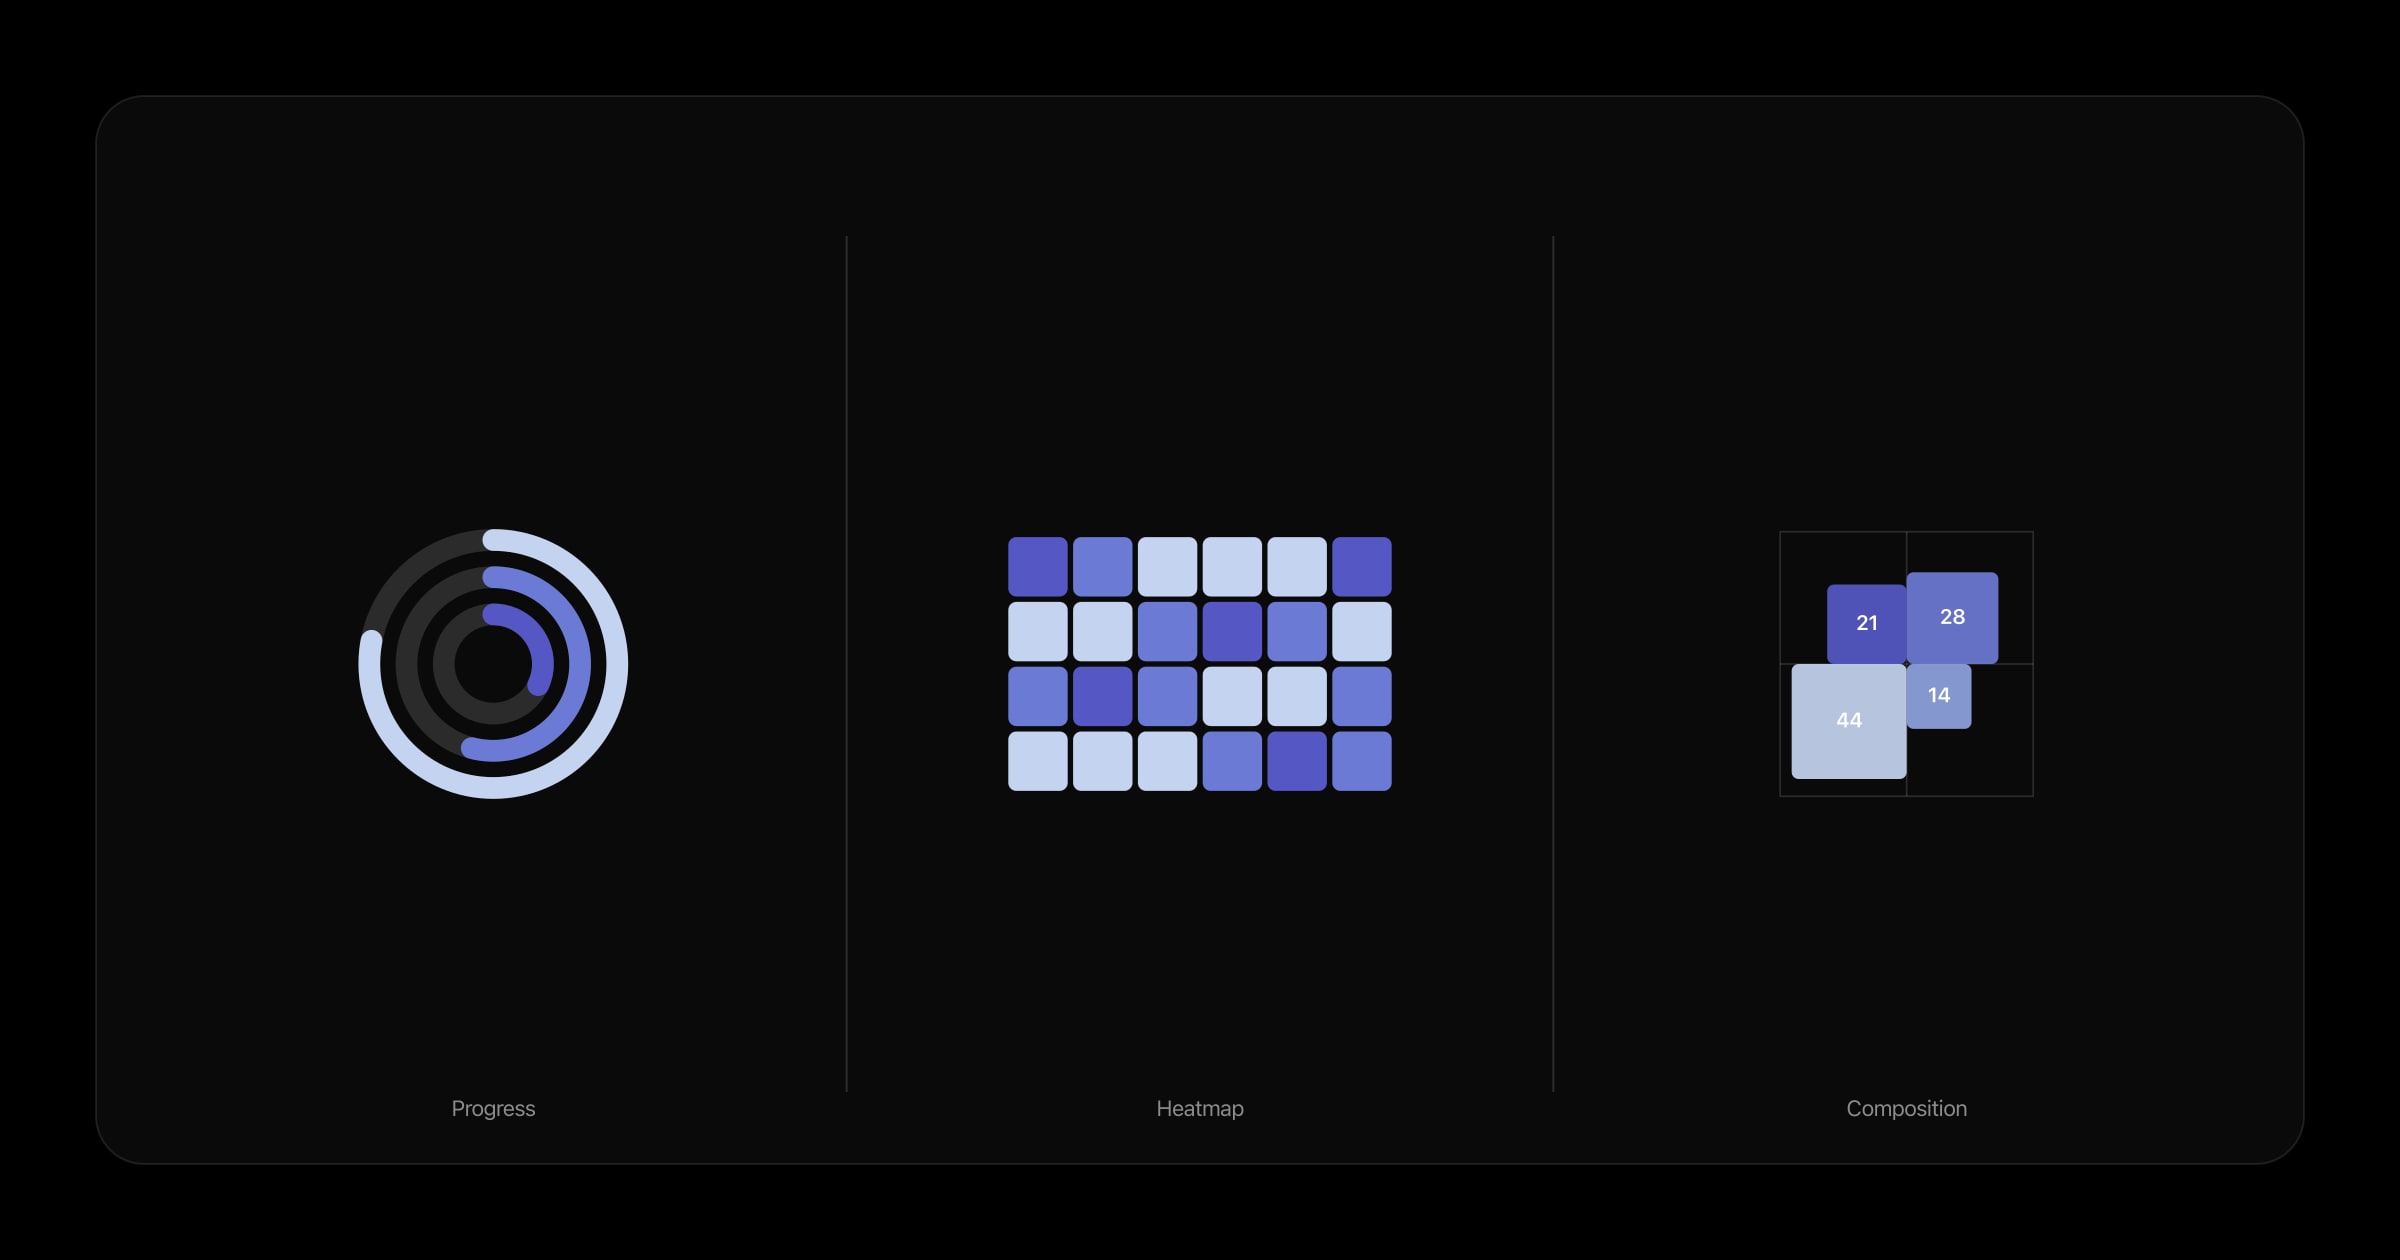
Heatmap
Four rows and six columns. Darker is higher.
Source: Illustrative. Drawn to show the form.يُستخدم. A value at every crossing of two lists, read as a pattern
لا يُستخدم. Exact reading of single values. Use a table
Dot plot
Five regions, one grey series, ranked against the dashed line.
Source: Illustrative. Drawn to show the form.يُستخدم. One value per category against a marked reference, such as a cohort median
لا يُستخدم. Dots with no reference to read them against
Bullet
Four measures. The bar is the actual. The gap runs to the target.
Source: Illustrative. Drawn to show the form.يُستخدم. Actual against target for several measures, with the shortfall visible
لا يُستخدم. Targets the piece does not state
Mirror bar
Two groups, same age bands, back to back from the centre.
Source: Illustrative. Drawn to show the form.يُستخدم. Two groups back to back across the same categories, such as two answers by age. By age and sex it is a population pyramid
لا يُستخدم. Groups that do not share the categories
Lollipop
Six items, ranked, each stem starting at zero.
Source: Illustrative. Drawn to show the form.يُستخدم. Many categories ranked, where bars would be a wall of ink
لا يُستخدم. A scale that does not start at zero
Big number
One count, read against the full hundred.
Source: Illustrative. Drawn to show the form.يُستخدم. One figure that carries the point, with what it is compared against, such as 37 of 100
لا يُستخدم. A number with no comparison, period or source
Table
Five regions. Share and value are both on the row, so the figure can be checked.
Source: Illustrative. Drawn to show the form.يُستخدم. Exact values the reader will look up, with bars or shading in the cells where a pattern matters
لا يُستخدم. A table where the reader needs the pattern, not the values. Draw the chart
9 أشكال
Line
One series, January to May. The circle marks the end. The dot sits inside it.
Source: Illustrative. Drawn to show the form.يُستخدم. A continuous trend over regular time
لا يُستخدم. Uneven gaps drawn as if they were even
Bump
The circle marks where February's leader finishes. The dot sits inside it.
Source: Illustrative. Drawn to show the form.يُستخدم. Rank order moving across several snapshots
لا يُستخدم. Values, when the size of the gap matters
Ridgeline
Four distributions, one row each. January to May runs along the base.
Source: Illustrative. Drawn to show the form.يُستخدم. The shape of a distribution, one row per period or group
لا يُستخدم. Fewer than four rows
Waterfall
Points. The opening and the result are levels. Each step between them is a signed change.
Source: Illustrative. Drawn to show the form.يُستخدم. A starting total carried to an ending total by the gains and losses between
لا يُستخدم. Contributions that do not add up to the change
Timeline
Five dated events on one line. The space between them is the time.
Source: Illustrative. Drawn to show the form.يُستخدم. Dated events in order, with the gaps between them meaningful
لا يُستخدم. Undated steps. Use a process
Gantt
Five pieces of work across the same dates. A dashed link marks the dependency.
Source: Illustrative. Drawn to show the form.يُستخدم. Pieces of work across dates, with overlaps and dependencies
لا يُستخدم. A plan nobody holds to
Area
One total, January to May. The circle marks the end. The dot sits inside it.
Source: Illustrative. Drawn to show the form.يُستخدم. One total over time, where the volume is the point
لا يُستخدم. Several overlapping areas. Use small multiples
Stock price
Eight sessions. The wick is the high and low. The wash is a down day.
Source: Illustrative. Drawn to show the form.يُستخدم. Open, high, low and close for each period, for a price
لا يُستخدم. Any measure that is not traded
Line and column
Columns are one measure and the line is the other. The circle marks the end.
Source: Illustrative. Drawn to show the form.يُستخدم. Two measures over the same periods, one as columns and one as a line, such as revenue and margin
لا يُستخدم. Two scales set so the measures appear to move together
The rest of the data is drawn quietly so the one that differs stands out.
Highlighted line
Five series. The circle marks where the gap opens. The dot sits inside it.
Source: Illustrative. Drawn to show the form.يُستخدم. One series against the pack, the rest muted and unlabelled
لا يُستخدم. Every series in full strength
Connected scatter
The circle marks the latest point. The dot sits inside it.
Source: Illustrative. Drawn to show the form.يُستخدم. How two measures moved together over time, the path joined in order
لا يُستخدم. A path the reader cannot follow without arrows
Arrow chart
Five items. The dot is the start. The arrowhead is the end.
Source: Illustrative. Drawn to show the form.يُستخدم. Where each item started and ended on one or two measures
لا يُستخدم. Arrows that cross so often they hide the movement
Parity scatter
Items on two measures. The circle marks the one that sits apart.
Source: Illustrative. Drawn to show the form.يُستخدم. Items against a line where the two measures are equal, so the one off the line shows
لا يُستخدم. A parity line with no meaning in the piece
A single line drawn as if it were certain says more than the data knows.
Confidence band
The wash is the uncertainty. The line is the centre. The dot is the end.
Source: Illustrative. Drawn to show the form.يُستخدم. A central estimate with the range it could plausibly fall in
لا يُستخدم. A band whose level of confidence is not stated
Fan chart
The wash is the forecast. The dot is the last observed point.
Source: Illustrative. Drawn to show the form.يُستخدم. A forecast whose range widens the further it reaches, after the last observed value
لا يُستخدم. A forecast drawn as a single line
Zones
The wash is good. The line is grey. The dot is the end, inside it.
Source: Illustrative. Drawn to show the form.يُستخدم. A measure over time against bands that say what is good, normal or poor
لا يُستخدم. Bands the piece does not define
Range bar
Four groups. Each bar runs from that group's low to its high.
Source: Illustrative. Drawn to show the form.يُستخدم. The low and high for each group, side by side
لا يُستخدم. Ranges with different meanings on one chart
Error bars
Four groups, ranked. The line is the baseline. The bar is the 95% interval.
Source: Illustrative. Drawn to show the form.يُستخدم. A point and its interval for each group, read against a reference
لا يُستخدم. An interval whose level of confidence is not stated
Violin
Three groups. The width at each height is how many sit there. The mark is the median.
Source: Illustrative. Drawn to show the form.يُستخدم. The full shape of a distribution for a few groups
لا يُستخدم. Readers who need only the median. Use a box plot or a dot plot
12 أشكال
Stacked or diverging bar
Four rows. Toward sits left of centre. Away sits right.
Source: Illustrative. Drawn to show the form.يُستخدم. Shares that add to a whole, or views split either side of neutral
لا يُستخدم. Eight or more segments
Treemap
Four parts of one whole. Area is the value.
Source: Illustrative. Drawn to show the form.يُستخدم. Part of a whole where the relative sizes are the point
لا يُستخدم. Parts too small to label
Marimekko
A whole split two ways. Width is one split. Height inside the column is the other.
Source: Illustrative. Drawn to show the form.يُستخدم. A whole split two ways at once, such as market by region and by segment
لا يُستخدم. A split the reader cannot name both ways
Funnel
Four stages. Each is a subset of the one before it.
Source: Illustrative. Drawn to show the form.يُستخدم. Drop-off from one stage to the next
لا يُستخدم. Stages that are not a subset of the one before
Polar
One series around a cycle, such as the months. Length is the value.
Source: Illustrative. Drawn to show the form.يُستخدم. One series across categories that repeat in a cycle, such as months
لا يُستخدم. Categories with no cycle
Pie
Two shares of one whole. The larger share is the point.
Source: Illustrative. Drawn to show the form.يُستخدم. Two or three shares of one whole, where one share is the point
لا يُستخدم. More than three slices, or two pies compared
Donut
Three segments of one whole. The total sits in the middle.
Source: Illustrative. Drawn to show the form.يُستخدم. The same as a pie, with the total in the middle
لا يُستخدم. More than three segments, or segments the reader must compare
Sunburst
One whole, two levels deep. The inner ring is the first split.
Source: Illustrative. Drawn to show the form.يُستخدم. A whole broken down two levels deep, as rings
لا يُستخدم. Three levels or more
Stacked area
Three parts of one total over time. Read the thickness, not a shared baseline.
Source: Illustrative. Drawn to show the form.يُستخدم. How the parts of a total moved over time
لا يُستخدم. More than four parts, or parts the reader must compare one by one
Streamgraph
Three parts. The shape of the mix matters more than any single value.
Source: Illustrative. Drawn to show the form.يُستخدم. How the mix ebbed and flowed, when the shape matters more than the values
لا يُستخدم. Exact reading of any part
Diverging area
Net gains and losses of the same thing. Above the line is one side, below is the other.
Source: Illustrative. Drawn to show the form.يُستخدم. Net gains and losses over time either side of zero
لا يُستخدم. Gains and losses that are not of the same thing
Pareto
Items ranked by size. The line is the running share of the whole.
Source: Illustrative. Drawn to show the form.يُستخدم. Items ranked by size, with a running total showing how few make up most of the whole
لا يُستخدم. Items that are not parts of one total
5 أشكال
Scatter
Two measures. No line of fit is drawn.
Source: Illustrative. Drawn to show the form.يُستخدم. Whether two measures move together
لا يُستخدم. A line of fit drawn with no reason given in the piece
Bubble
Two measures set the position. Larger is more of a third measure.
Larger is more.
Source: Illustrative. Drawn to show the form.يُستخدم. A scatter with a third measure that matters, as size
لا يُستخدم. Size the reader is asked to compare exactly
Beeswarm
Every item along one measure, one dot each.
Source: Illustrative. Drawn to show the form.يُستخدم. Every item along one measure, one dot each
لا يُستخدم. More dots than the size can hold apart
Box plot
Four groups, ranked. Multiple of the baseline, log scale. The bar is the 95% interval.
Source: Illustrative. Drawn to show the form.يُستخدم. A point and its interval for each group, read against a reference
لا يُستخدم. An interval whose level of confidence is not stated
Histogram
One measure, bins of equal width, each bar from zero.
Source: Illustrative. Drawn to show the form.يُستخدم. How one measure is spread, in bins of equal width
لا يُستخدم. Bins of unequal width without saying so
Several small charts on one shared scale read faster than one crowded chart.
Small multiples
The same chart, six times, on one shared scale.
Source: Illustrative. Drawn to show the form.يُستخدم. The same chart repeated for each group on one shared scale
لا يُستخدم. Scales that change from panel to panel
Sparkline
The circle marks a row that finishes higher. The dot sits inside it.
Source: Illustrative. Drawn to show the form.يُستخدم. A trend in the space of a word
لا يُستخدم. A sparkline the reader must read values from
Calendar heatmap
Daily values laid out as weeks. Darker is higher.
Source: Illustrative. Drawn to show the form.يُستخدم. Daily values laid out as weeks, so the rhythm of the week shows
لا يُستخدم. Data that is not daily
Parallel coordinates
Five items, four measures. Each line is one item.
Source: Illustrative. Drawn to show the form.يُستخدم. Several items compared on many measures at once, one line each
لا يُستخدم. More items than the lines can keep apart
People are counted as rates per person, never as raw totals spread over area.
Waffle
One share, counted as a hundred units.
Source: Illustrative. Drawn to show the form.يُستخدم. A share of a group shown as a hundred people or units, some filled
لا يُستخدم. Shares that do not count people or units
Lorenz curve
Share of the people against share of the thing. The dashed line is perfect equality.
Source: Illustrative. Drawn to show the form.يُستخدم. How unequally something is shared, against a line of perfect equality
لا يُستخدم. A curve with no equality line to read it against
8 أشكال
Sankey
Width is the amount. The bands at each stage add back to the same total.
Source: Illustrative. Drawn to show the form.يُستخدم. An amount splitting and joining across stages, with width as the amount
لا يُستخدم. Widths that do not add up across a stage
Process
A sequence with no branch. Each arrow is what passes to the next step.
Source: Illustrative. Drawn to show the form.يُستخدم. Steps in order, with what passes between them
لا يُستخدم. Branches. Use a flowchart
Flowchart
One decision. The straight path is one branch. The lower path is the other.
Source: Illustrative. Drawn to show the form.يُستخدم. A decision with branches, each branch labelled
لا يُستخدم. A branch that ends nowhere
Swimlane
Three owners, in rows. Each arrow is a handoff.
Source: Illustrative. Drawn to show the form.يُستخدم. Steps owned by several people or teams, with each handoff shown
لا يُستخدم. One owner. Use a process
Sequence
Three actors. Time runs down the page. Each arrow is a message.
Source: Illustrative. Drawn to show the form.يُستخدم. Messages between actors, in time order down the page
لا يُستخدم. A step with no sender or receiver
States
One thing, four states. The double ring is the ending.
Source: Illustrative. Drawn to show the form.يُستخدم. One thing moving through states, with what moves it, including waits, retries and endings
لا يُستخدم. States the thing cannot actually be in
Loop
Four steps around a cycle. The arrow shows the return.
Source: Illustrative. Drawn to show the form.يُستخدم. A cycle where the last step feeds the first, and something builds up each time round
لا يُستخدم. A list of steps that does not return. Use a process
Chord
Flows both ways around a circle. Width is the amount.
Source: Illustrative. Drawn to show the form.يُستخدم. Flows between a handful of groups in both directions, around a circle
لا يُستخدم. More groups than the circle can label
9 أشكال
Tree
One root, two children, and four grandchildren.
Source: Illustrative. Drawn to show the form.يُستخدم. Parent and children, one parent each
لا يُستخدم. A child with two parents. Use a dependency graph
Org chart
Who reports to whom. The small boxes are the extra reports.
Source: Illustrative. Drawn to show the form.يُستخدم. Who owns, reports to or escalates to whom, for people, teams or agents
لا يُستخدم. Names the person has not cleared to show
Nested
Three levels of containment. What sits inside what.
Source: Illustrative. Drawn to show the form.يُستخدم. Hierarchy by containment: what sits inside what
لا يُستخدم. More than three levels deep
Layers
Four levels, stacked. The top one depends on the rest.
Source: Illustrative. Drawn to show the form.يُستخدم. Levels stacked by abstraction, each resting on the one below
لا يُستخدم. Layers that do not depend on each other
Pyramid
Four ranks, widest at the base.
Source: Illustrative. Drawn to show the form.يُستخدم. A ranked hierarchy, widest at the base
لا يُستخدم. A ranking the piece does not argue
Venn
Three sets. The filled middle is the overlap of all three.
Source: Illustrative. Drawn to show the form.يُستخدم. Overlap between two or three sets, with the overlap named
لا يُستخدم. Four or more sets
Exploded view
Three parts of one object, in assembly order, along one line.
Source: Illustrative. Drawn to show the form.يُستخدم. The parts of one object pulled apart along one line, in assembly order
لا يُستخدم. Parts that do not assemble into the whole
Plan view
One site, seen from above at an angle.
Source: Illustrative. Drawn to show the form.يُستخدم. One floor or site seen from above at an angle: rooms, zones, phases
لا يُستخدم. Places the piece does not describe
Network
Nine nodes. The links are the point. The centre is marked.
Source: Illustrative. Drawn to show the form.يُستخدم. Who or what is connected to whom, when the links are the point
لا يُستخدم. Every link drawn when only a few matter
4 أشكال
Quadrant
Two axes. High is marked on each. One point is the outlier.
Source: Illustrative. Drawn to show the form.يُستخدم. Items placed on two axes, each axis named for what high and low mean
لا يُستخدم. Axes that are not independent
Value map
Needs against how settled each part is. The user sits at the top.
Source: Illustrative. Drawn to show the form.يُستخدم. A chain of needs set against how settled each part is, to show what to build, buy or leave
لا يُستخدم. A chain with no user at the top
Fishbone
The box on the right is the effect. Each rib is a kind of cause.
Source: Illustrative. Drawn to show the form.يُستخدم. The causes of one observed effect, grouped by kind
لا يُستخدم. Causes the piece does not name
Dependency graph
Shared parts a tree cannot show. The arrow marks the critical step.
Source: Illustrative. Drawn to show the form.يُستخدم. What depends on what, with shared parts and cycles a tree cannot show
لا يُستخدم. Every link, when only the critical path matters
For a piece about a choice or a market: the options, the forces at work and what each pays.
Decision tree
A choice, then a chance. Each branch ends in a value.
Source: Illustrative. Drawn to show the form.يُستخدم. Choices and chances branching to outcomes, each with its value
لا يُستخدم. Probabilities or payoffs the piece does not state
Payoff matrix
Two players, two moves each. Each cell holds what both get.
Source: Illustrative. Drawn to show the form.يُستخدم. What each of two players gets for each pair of moves
لا يُستخدم. More than two players, or moves the piece does not name
Curves and optimum
The crossing is the best choice. The guides mark that point on both axes.
Source: Illustrative. Drawn to show the form.يُستخدم. Two curves whose crossing or peak marks the best choice
لا يُستخدم. An optimum the piece does not argue
Game tree
Turns down the tree. Each end holds what both players get.
Source: Illustrative. Drawn to show the form.يُستخدم. Moves made in turn by two players, each branch ending in what both get
لا يُستخدم. Moves or payoffs the piece does not name
Issue tree
One question, three branches, and the branches split once more.
Source: Illustrative. Drawn to show the form.يُستخدم. A question broken into parts that do not overlap and together cover it
لا يُستخدم. Branches that overlap or leave a gap
Five forces
Rivals sit in the middle. Entrants, substitutes, buyers, and suppliers press in.
Source: Illustrative. Drawn to show the form.يُستخدم. The pressures on a market's profits: rivals, new entrants, substitutes, buyers and suppliers
لا يُستخدم. Forces drawn without saying which one bites
Value chain
Support above the line, five primary steps below it, and the margin at the end.
Source: Illustrative. Drawn to show the form.يُستخدم. The steps a business takes to make and deliver what it sells, and where it earns its margin
لا يُستخدم. Steps the business does not own, drawn as its own
Strategy canvas
Two offers, scored on the same five factors.
Source: Illustrative. Drawn to show the form.يُستخدم. Competitors' offers scored on the same factors, one line each
لا يُستخدم. Factors or scores the reader cannot check
S-curve
The circle marks the steep middle. The dot sits inside it.
Source: Illustrative. Drawn to show the form.يُستخدم. Adoption or performance that starts slow, climbs, then levels off
لا يُستخدم. A curve fitted to too few points
Three horizons
The circle marks the end of curve 3. The dot sits inside it.
Source: Illustrative. Drawn to show the form.يُستخدم. Today's business, the next one and the one after, set against time and value
لا يُستخدم. Horizons with no investment named in each
Portfolio matrix
Growth up the page, share to the right. Larger is more revenue.
Larger is more.
Source: Illustrative. Drawn to show the form.يُستخدم. Business units on two axes such as market growth and share, sized by revenue
لا يُستخدم. Cut-off lines the piece does not state
A map is used only when the place is the cause, as Social Assets sets out.
Choropleth
A rate per area. Darker is higher. The map is not a count of people.
Source: Illustrative. Drawn to show the form.يُستخدم. A rate per area, shaded by region
لا يُستخدم. Raw totals, which only show where people live
Proportional symbol map
Amounts at places. Larger is more.
Larger is more.
Source: Illustrative. Drawn to show the form.يُستخدم. Amounts at places, sized by value
لا يُستخدم. Symbols that overlap so much they hide each other
Flow map
Movement between places. Width is the amount.
Source: Illustrative. Drawn to show the form.يُستخدم. Movement between places, with width as the amount
لا يُستخدم. Every route drawn when a few carry the argument
Route map
One path. The numbers are the stops, in the order taken.
Source: Illustrative. Drawn to show the form.يُستخدم. The path taken, with its stops in order
لا يُستخدم. A route the piece does not describe
Tile map
Every region is an equal square, so a small place still counts.
Source: Illustrative. Drawn to show the form.يُستخدم. Every region as an equal tile, so small regions count
لا يُستخدم. Readers who need the real shapes to find a region
Cartogram
Regions resized by a value. Area is that value. Shade is a second reading.
Source: Illustrative. Drawn to show the form.يُستخدم. Regions resized by a value, such as population
لا يُستخدم. A value readers cannot recover from the distortion
Dot density
One dot per so many. The cluster is the count, not a street address.
Source: Illustrative. Drawn to show the form.يُستخدم. How a count spreads across a place, one dot per so many
لا يُستخدم. Dots read as exact locations
4 أشكال
Journey
Four stages along the top. The line is how it feels at each one.
Source: Illustrative. Drawn to show the form.يُستخدم. What a person does across the stages of an experience, and how it feels
لا يُستخدم. Feelings the piece does not report
Service blueprint
Three moments. Above the line is the customer. Below it is the work out of sight.
Source: Illustrative. Drawn to show the form.يُستخدم. What the customer sees against what the service does out of sight, with the line between them
لا يُستخدم. Steps nobody owns
Story map
A backbone of four steps, sliced into releases. Below the line waits.
Source: Illustrative. Drawn to show the form.يُستخدم. A narrative backbone, sliced into releases, with the cut line drawn
لا يُستخدم. A backlog with no order
Board
Three states. Cards move right as the work moves.
Source: Illustrative. Drawn to show the form.يُستخدم. Work in progress by state, with limits and blocked items
لا يُستخدم. A board that is not kept current
For people who write about technology. Each is a diagram, held to the same rules.
Architecture
A snapshot of the parts and how they connect. The dashes are the boundary.
Source: Illustrative. Drawn to show the form.يُستخدم. Parts of a system and how they connect, in one snapshot, with boundaries of trust or ownership
لا يُستخدم. Every service, when three carry the argument
Before and after
The same layout, drawn twice. The extra link is what changed.
Source: Illustrative. Drawn to show the form.يُستخدم. A change in structure, drawn twice on the same layout, with a list of what changed
لا يُستخدم. A change in settings only. Use a table
Current state
Three phases, as they stand today. This is not the target.
Source: Illustrative. Drawn to show the form.يُستخدم. A landscape as it stands today, by phase or department
لا يُستخدم. Today's picture labelled as the target
Data flow
Four steps. The arrow is the data. The mark below is who handles it.
Source: Illustrative. Drawn to show the form.يُستخدم. Who does what to the data at each step
لا يُستخدم. Steps without an owner
Integration map
Sources on the left, the core in the middle, readers on the right.
Source: Illustrative. Drawn to show the form.يُستخدم. Sources, a core and the people or systems that use it
لا يُستخدم. Every source, when the argument needs the shape
Tiers of data
Three levels of quality. The arrow is who may move up.
Source: Illustrative. Drawn to show the form.يُستخدم. Storage in levels of quality, with who may reach each
لا يُستخدم. Levels the system does not enforce
Access matrix
Rows are roles. Columns are parts. A dot is permission.
Source: Illustrative. Drawn to show the form.يُستخدم. Which role may do what to which part
لا يُستخدم. Permissions nobody has checked
Deployment
Where it runs. The line between the zones is the only link drawn.
Source: Illustrative. Drawn to show the form.يُستخدم. Where software runs: zones, hosts, copies, ports
لا يُستخدم. Detail a reader of the piece will not use
Data model
Three things. The bar on each box is its name. The lines are the relations.
Source: Illustrative. Drawn to show the form.يُستخدم. Things, their fields and how they relate
لا يُستخدم. Every field, when the relation is the point
Schema
Physical tables. The header is the name. The rows are the fields. The line is the key.
Source: Illustrative. Drawn to show the form.يُستخدم. Physical tables, types, keys and indexes
لا يُستخدم. A reader who is not building on it
Class diagram
The hollow arrow points at the parent. The lower boxes are the children.
Source: Illustrative. Drawn to show the form.يُستخدم. Classes, what they do, and how they inherit or contain
لا يُستخدم. A different kind of software diagram drawn in its notation
The catalog already says not to reach for these.
Radar
Five scores for one entity, on a shared scale. The shape is not an ordering.
Source: Illustrative. Drawn to show the form.يُستخدم. Three to five scores on a common scale, for one to three entities
لا يُستخدم. Ranking. Use a bar
Versus baseline, peer, prior, or target.
Index vs control · period 0 = 0 · 6 periods
Source: Illustrative product analytics (fictional)Score 0–100 · before vs after · demo pair
Source: Illustrative experiment (fictional)Score 0–100 · you vs cohort median · Q2 2025
Source: Illustrative product health benchmark (fictional)Score by category — you vs. cohort average
Source: Demo dataActual versus the gap to target. A longer bar is not a win: cost per signup is already over target.
Source: Illustrative OKR dashboard (fictional)Two values compared, sorted by size of gap
Source: Demo data% within age band · Leave vs Remain · Jul 2025 poll
Source: Fictional omnibus survey, n=1,800Last 7 days
Source: Demo dataMark the series or period that breaks the pack.
Metric by cohort, over time
Source: Demo dataBrand health vs price sensitivity · index · 2018–2024
Source: Illustrative brand tracker (fictional)Arrow points from before → after, on two measures at once
Source: Demo dataA vs B, with the flagged outlier called out
Source: Demo dataRank over time — 1 is top
Source: Demo dataPounds. Start and end are levels. The other columns are signed changes.
Source: IllustrativeStaff, rent and VAT take almost all of it. Profit is what the café keeps on the cup.
Source: Grind, via The Guardian, 13 July 2026Index over time
Source: Demo dataAbove Average
Source: Demo dataBands, fans, and distributions — not just the point.
Modelled estimate · 95% CI · t = −2…11
Source: Illustrative statistical model (fictional)MAU (thousands) · UK + IE fintech · Aug 2025 forecast
Source: Illustrative MAU projection (fictional)Aug 2024 – Aug 2025. Score. The axis starts at 20.
Source: Demo dataMin–max per period, by group
Source: Demo dataMultiple of the baseline, log scale. The bar is the 95% interval.
Source: IllustrativeDistribution by group
Source: Demo dataEach dot is one observation
Source: Demo dataDays-to-first-value density · H1 2025 cohort · by segment
Source: Illustrative onboarding timing (fictional)One line per item, one axis per dimension
Source: Demo dataShared-scale panels beat spaghetti.
Sales index · Jan 2025 = 100 · six UK regions · Jun 2025
Source: Illustrative regional sales index (fictional)Inline sparklines
Source: Demo dataIndex over time
Source: Demo dataSupport tickets per day · EU timezone · Jul–Aug 2025
Source: Illustrative helpdesk export (fictional)Intensity by row and month
Source: Demo dataWaffles and rates — not raw choropleths.
People per 100 · UK bank app adopters · Mar 2025
Source: Illustrative adoption survey (fictional), n=2,400Event share vs per 100 people · five UK regions · 2024
Source: Illustrative public-health events (fictional)Cumulative income share · household deciles · FY2024
Source: Illustrative inequality snapshot (fictional)Share of total exposure · schematic regions · demo
Source: Teaching toy (not Natural Earth)Forms that usually fail the job.
Pick a better form when you see these
Source: Data Visualisation lab — judgment notesHow you're performing in each category, 0–100
Source: Demo dataShare of total, %
*Percentages may not sum to 100 due to rounding.
Source: Demo dataWhen the mix is the story.
Motors reached factories in 1883. The gains waited for the redesign.
Source: Huang, NVIDIA Blog (2026); Devine (1983)Most later drawings show four. The missing floor answers why.
Source: Ackoff (1989), via Bernstein (2009) and Frické (ISKO)% responding, by period
Source: Demo pollingCount at each stage
Source: Demo dataMost used
Source: Demo dataRectangle size = share of total
Source: Demo dataInner ring = category, outer ring = sub-item
Source: Demo dataValue-sized quadrants — box area is proportional to value
Source: Demo dataStage-to-stage volume
Source: Demo dataShare reporting each frequency, %
Source: Demo dataStacked with a wiggle baseline, not a flat one
Source: Demo dataGains above the line, losses below
Source: Demo dataWhen place is causal.
Composite index by country, 0–100
Source: Demo dataIndex 0–100, trailing 5 periods
Source: Demo dataAll states and union territories
Source: Demo dataValue by location. Cyan is the claim. Larger is more.
Larger is more.
Source: Demo dataPath over time, by stop
Source: Demo dataBy state, % of population
Source: Demo dataStrategy diagrams.
Decision tree with chance nodes — outcomes weighted by probability
*EV = (payoff × probability) + (payoff × probability). Choose the branch with the higher expected value.
Source: Demo dataSequential game tree — the entrant moves first, the incumbent responds
*Payoffs shown as (Entrant, Incumbent). Backward induction: the incumbent accommodates rather than fights (2 > –2), so entry is rational and the incumbent’s threat is not credible.
Source: Demo dataPayoff matrix — (Player A, Player B), classic Prisoner's Dilemma
Source: Demo dataStag Hunt: high payoff if both cooperate, but risk of mutual loss
Source: Demo dataBest-response curves — Firm B's optimal quantity given Firm A's choice
The Nash equilibrium occurs where both firms' best-response curves intersect. Each firm is maximising profit given the other's choice.
Source: Demo dataBidder payoff by bid level (sealed-bid first-price auction)
The optimal bid balances the probability of winning (higher bid = higher P(win)) against payoff if winning (bid = lower profit margin).
Source: Demo dataPrisoner's Dilemma — share of rounds both players cooperated
Both players start cooperating, but incentives to defect build. Once defection begins, cooperation rarely returns.
Source: Demo dataNode size = importance, line = relationship
Source: Demo dataاطّلع على الخطط أو اسأل سؤالاً.
أضف هذا الرابط إلى قارئ RSS للحصول على المقالات والتحديثات الجديدة تلقائياً.


